Profiling mobile users:
user identification through analysis of LTE app traffic

In this study, we have explored the feasibility of user identification through the analysis of passive mobile network traffic. The underlying concept is rooted in the unique set of applications installed on each individual's mobile device. These distinct applications produce diverse traffic patterns, resulting in a personalized digital fingerprint within the mobile network data. Detecting and recognizing these fingerprints within the mobile network traffic allows for the identification, tracking, and profiling of users.
This research entailed an exceptional amount of effort, involving the navigation of numerous challenges. This page offers a glimpse into our findings. For a comprehensive view of the complete research, kindly refer to the 61-page PDF document provided below.
Despite the use of the pronoun "we" for academic convention throughout this page, it's essential to clarify that everything in this research was conducted by myself and no one else.
In this thesis, we examine the possibility of fingerprinting users, based on the apps that they have installed on their phones. We research whether a set of apps will generate specific patterns in LTE traffic, when users are not actively using their phone. We repeatedly alternate between different sets of apps and record their passive LTE traffic in separate recordings. By extracting Autonomous System (AS) numbers to create a vector for each recording, we can apply different distance metrics on the vectors to determine the similarity between recordings. By applying this method on 60 minute recordings, we demonstrate that we can derive what set of apps was being used in 100% of the recordings. When using a shorter recording time of only 5 minutes, we show that it is still possible determine the correct set of apps in 98%-100% of the cases, by choosing the right distance metric. This shows that an attacker with eavesdropping capabilities only requires a very short period of time to be able to identify the user that has generated that LTE network traffic. This constitutes a serious privacy infringement that requires the implementation of appropriate countermeasures.
The concept is as follows: an attacker orchestrates a Man-in-the-Middle (MitM) attack between a cell tower and mobile users, allowing him to access to the users' traffic. Subsequently, the attacker can apply labels to this network traffic. In the illustrations below, the attacker executes this attack in two distinct locations, namely a coffee shop and a shopping mall.
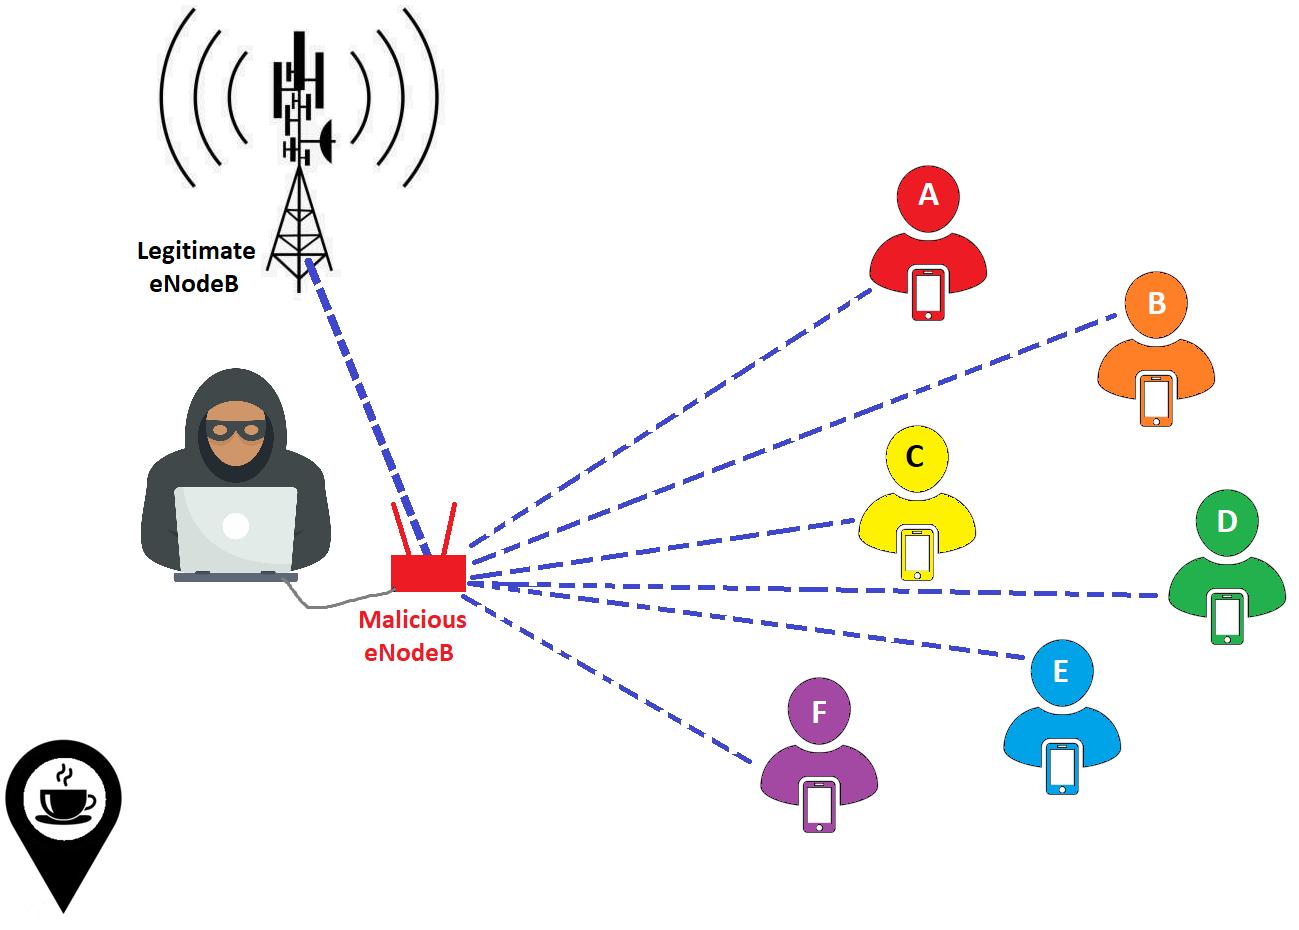
At the coffee shop.
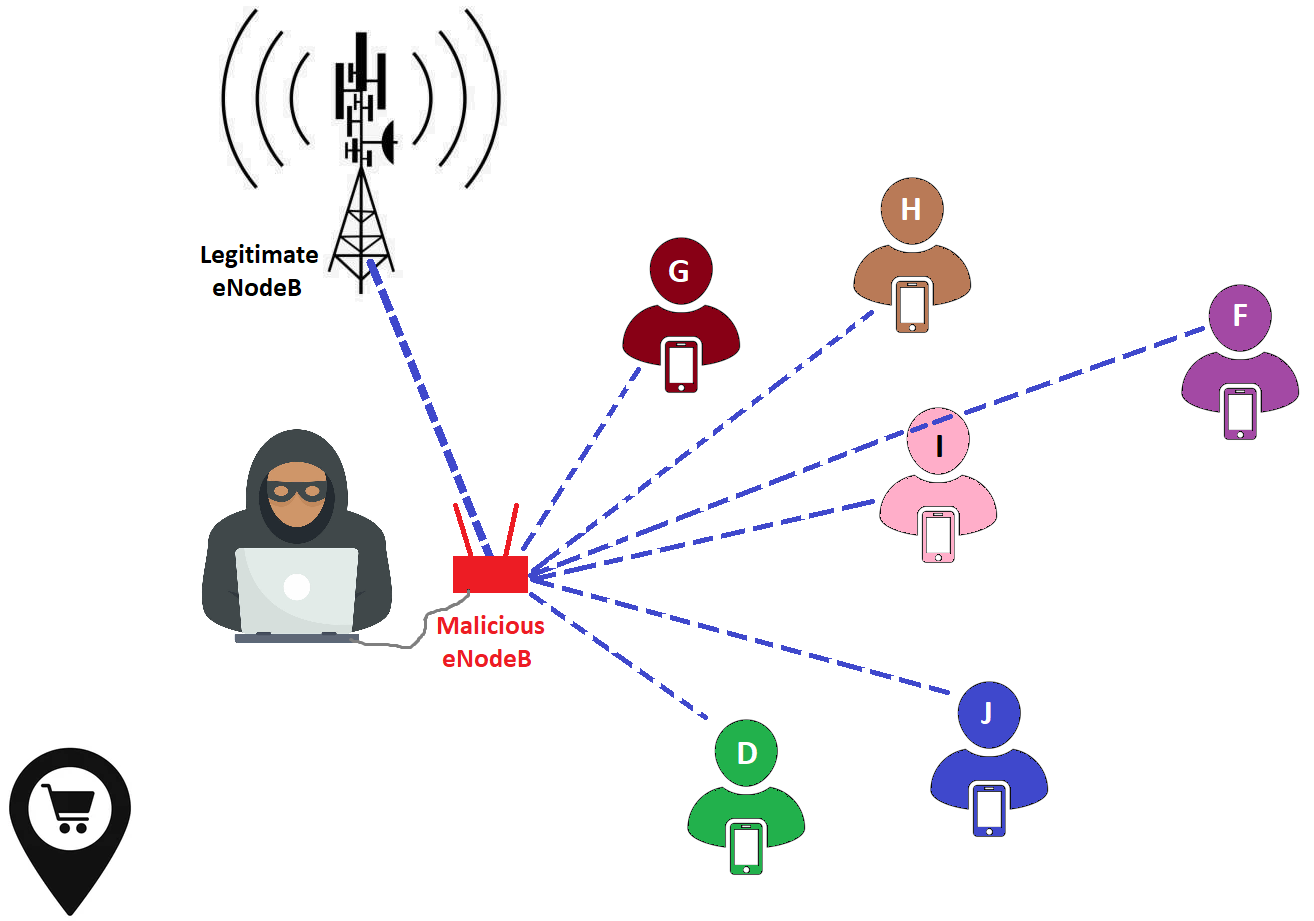
At the mall.
While the traffic patterns observed at the mall largely diverge from those at the coffee shop, the attacker also detects some noteworthy similarities. Specifically, two users' patterns closely resemble those of users he has previously examined, previously identified as D and F. Consequently, the attacker deduces that users D and F have been present at both the coffee shop and the mall. The attacker has now successful tracked these users.
By implementing this method across numerous locations, the attacker can systematically track multiple users and compile detailed profiles on them. Remarkably, this can all be accomplished by analyzing passive traffic, which arises from apps while the phone remains idle, typically unnoticed by the users who carry their phones in their pockets. In the following sections, we will quickly delve into our findings that confirm the effectiveness of this approach.
In our setup, we established a dedicated 4G/LTE network using a laptop, with a software-defined radio (SDR) serving as the cell tower. We connected a mobile phone to this LTE network and maintained control over the phone through our laptop via a USB cable. Additionally, we integrated a USB hub into our setup, which proved essential for resetting the SDR in case it encountered any operational issues. The USB hub allowed us to reboot both the power and USB connection to the SDR, effectively resolving any crashes or glitches it experienced.

Even though there is only one phone in this setup, we could use it to simulate multiple users. We explain how this works in the section below.
Despite having only one phone at our disposal, we could simulate multiple users on it by adopting the following methodology. We began by installing the 500 most popular global mobile applications on the device. We could view those apps as a matrix with 500 dots:

Green dots resemble an app that is enabled, whereas a gray dot resembles a disabled app. In the image above, all apps are enabled. But after we have them installed, we can also disable all of these apps. The matrix will then look like this:

To simulate an individual user, we could then re-enable a randomly generated subset of 50 apps, which we call a "profile".
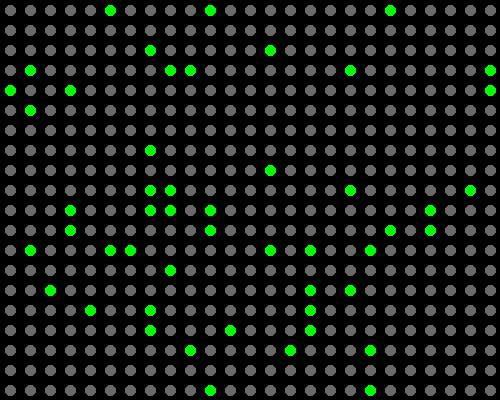
We could then record the distinct traffic patterns that resulted from the apps inside this profile. This way, we effectively recorded the LTE network traffic of one user. After recording, we disabled the apps in that profile. We then activated a different profile.
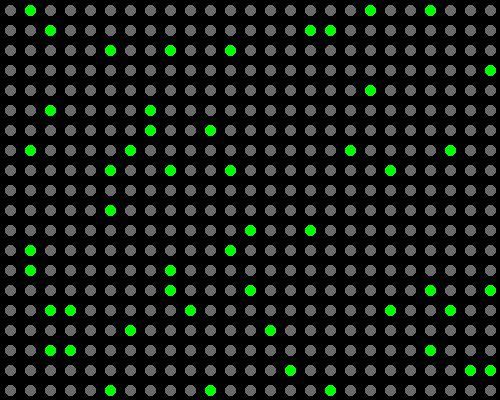
After having recorded the traffic that resulted from this second randomly generated subset of apps, we could disable them again and activate yet another profile:
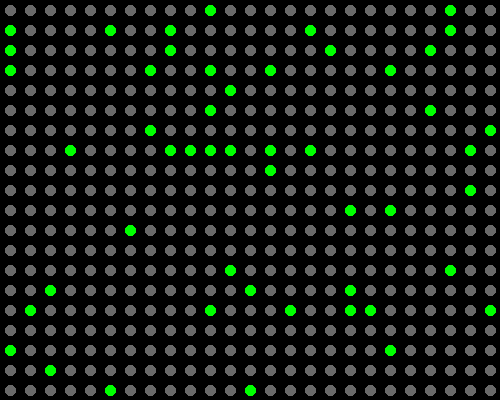
We then recorded the traffic from this third profile and disabled the apps afterwards. We have now shown the steps for recording the traffic of 3 profiles that simulate 3 users. However, we used 20 profiles in our setup. After having recorded all 20 profiles, we activated the first profile again and repeated all of the steps until we had recorded the traffic from every profile again. And then again and again...until we had recorded each of the profiles 10 times.
Consequently, we accumulated a total of 200 output files containing LTE network traffic data in .pcap format. Since each recording session was precisely one hour in duration, the total recording time was 200 hours.
In order to create this setup, we had to face numorous difficult challenges. This includes the following:
- finding a way to install 500 apps on one phone
- rooting the phone to be able to enable and disable apps using ADB
- prevent overheating of the setup that continously ran for more than 200 hours
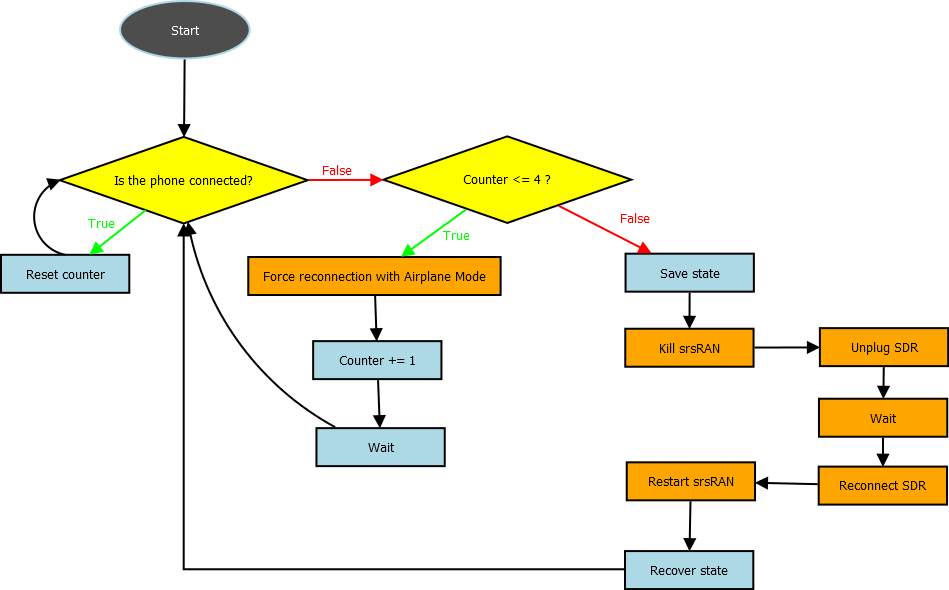
Dealing with frequent crashes from various components in our setup posed another significant challenge. The network software (srsRAN), the firmware, and the hardware of the SDR all exhibited high levels of instability. Manual intervention to recover from crashes would have substantially hindered the recording process. Consequently, we implemented an automated system to detect crashes and initiate recovery, ensuring seamless continuity in our recording process following any such incidents.
To ensure the phone's continuous connection to our LTE network, we conducted regular checks on its connection status. If we detected a disconnection, our approach involved attempting to force a reconnection to our LTE network. This was done by toggling airplane mode on and off several times. In cases where this method proved ineffective, we took more drastic measures. This included terminating the software managing our LTE network (srsRAN) and effectively "unplugging" the SDR. To elaborate on the latter, we employed a USB hub to cut power to the SDR and reset its USB connection.
Throughout this process, it was crucial to carefully manage the state of our setup. For instance, when the setup crashed 37 minutes into recording profile 7 for the third time, we ensured that it seamlessly resumed recording for the remaining 23 minutes after recovering from the crash. This meticulous state management allowed us to achieve the full 1-hour recording duration for each profile.
All of the above can be summarized in the flowchart below:
For each of the output pcap files, we will extract all of the IP addresses and convert them to Autonomous System Numbers (ASNs). In other words, we will create a list of AS numbers for every pcap file. While we will do this for all 200 pcap files, here is a simplified example with only 5 pcap files:

We then create one distinct array that contains all of the ASNs from all the pcaps:

For each pcap file, we can now loop through that big array and see if the numbers in that array also appear in the list of ASNs from the pcap file that we are currently looking at. If it does, we write down a 1. Otherwise, we will write down a 0. That means that we will get the following Boolean vectors for the five pcap files in this example:

We can now compare the Boolean vectors of any two pcap files and determine their similarity. Based on their similarity, we could tell whether the same profile was activated in both pcaps or that the traffic is from two different users. We determine the similarity of two Boolean vectors using a distance metric for Boolean vectors. Here are some examples:
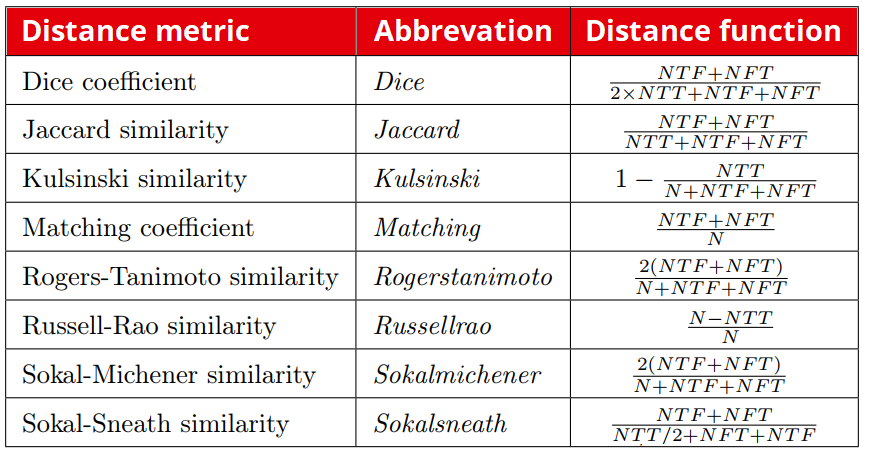
Because we don't know which of these distance metrics performs best for our attack, we will use all of them and compare their results.
For every pcap file, we have included the number of the profile that was used in its filename. So we already know to which user the traffic in each pcap file belongs. However, our goal is to be able to derive the profile from a pcap file, without using that knowledge. After doing so, we can look at the filename to see if we derived the profile correctly. Here is how we proceed.
First, consider this simplified example with only 15 pcap files:
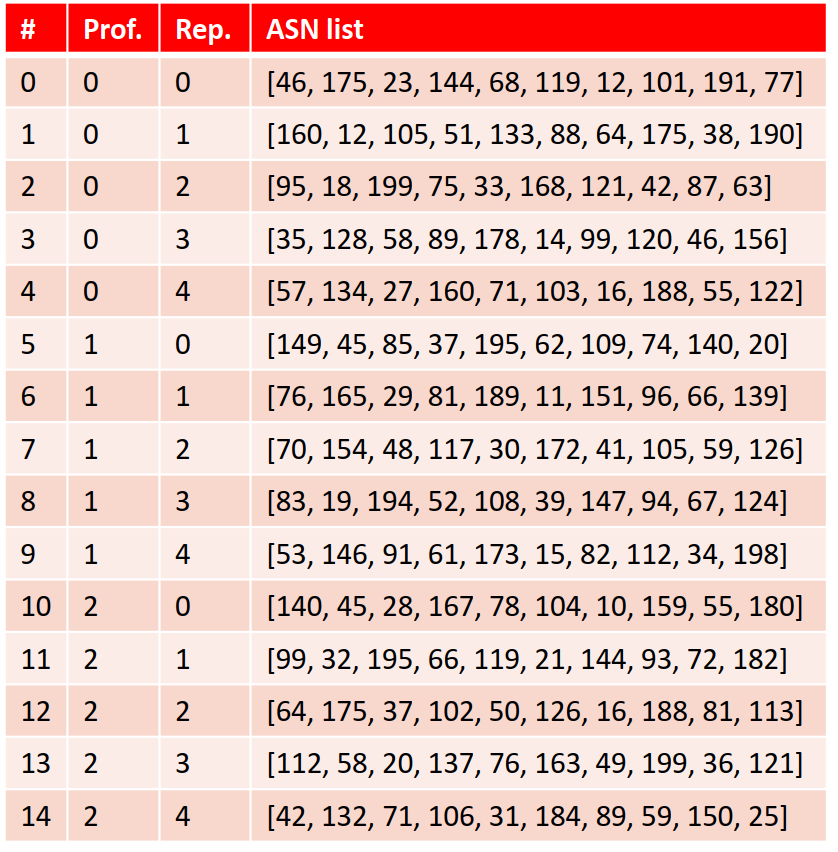
We have the following list of ASNs found in one pcap: [76, 165, 29, 81, 189, 11, 151, 96, 66, 139]. Our goal is to derive the profile/user to which this belongs. We can do that by determining the similarity of the Boolean vector of this ASN list and the Boolean vectors of the other pcap files, using the aforementioned distance metrics. In other words, we can write down the similarity of this ASN list with all other pcap files:
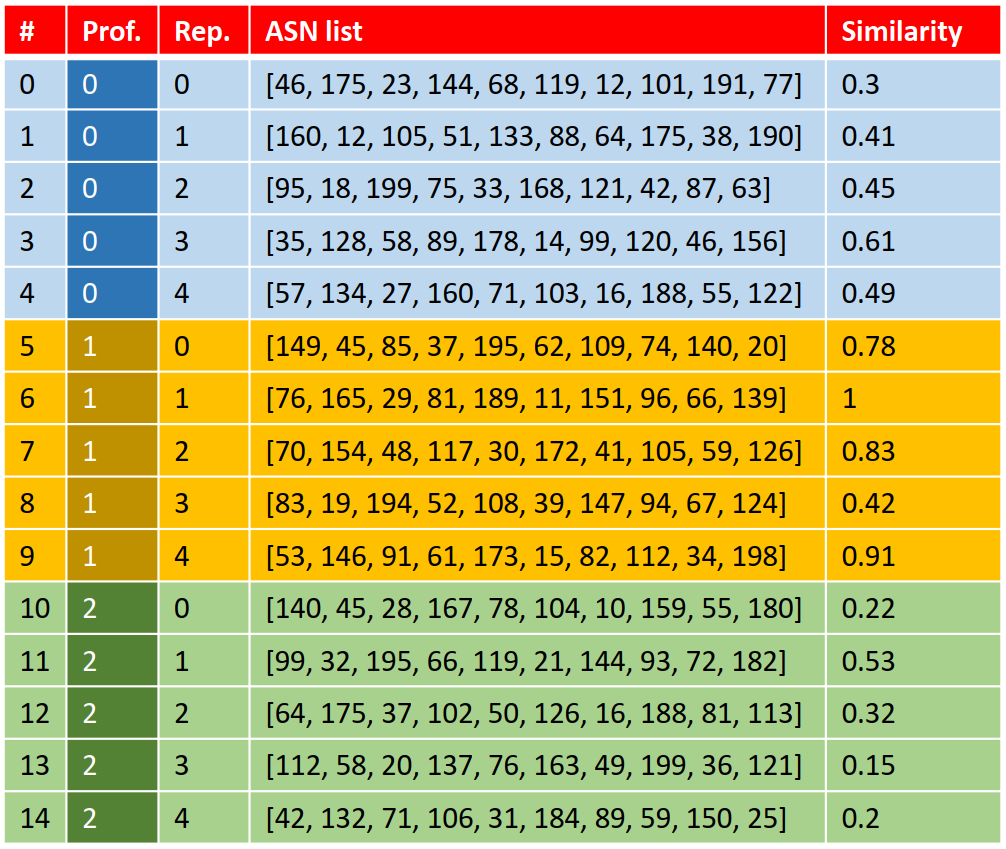
We can now aggregrate these scores by profile. However, we can also see that the ASN list [76, 165, 29, 81, 189, 11, 151, 96, 66, 139] appears in the database itself. We don't want to compare the ASN list with itself, so we will exclude that pcap from our comparison. We will then get the following similarity scores per profile:
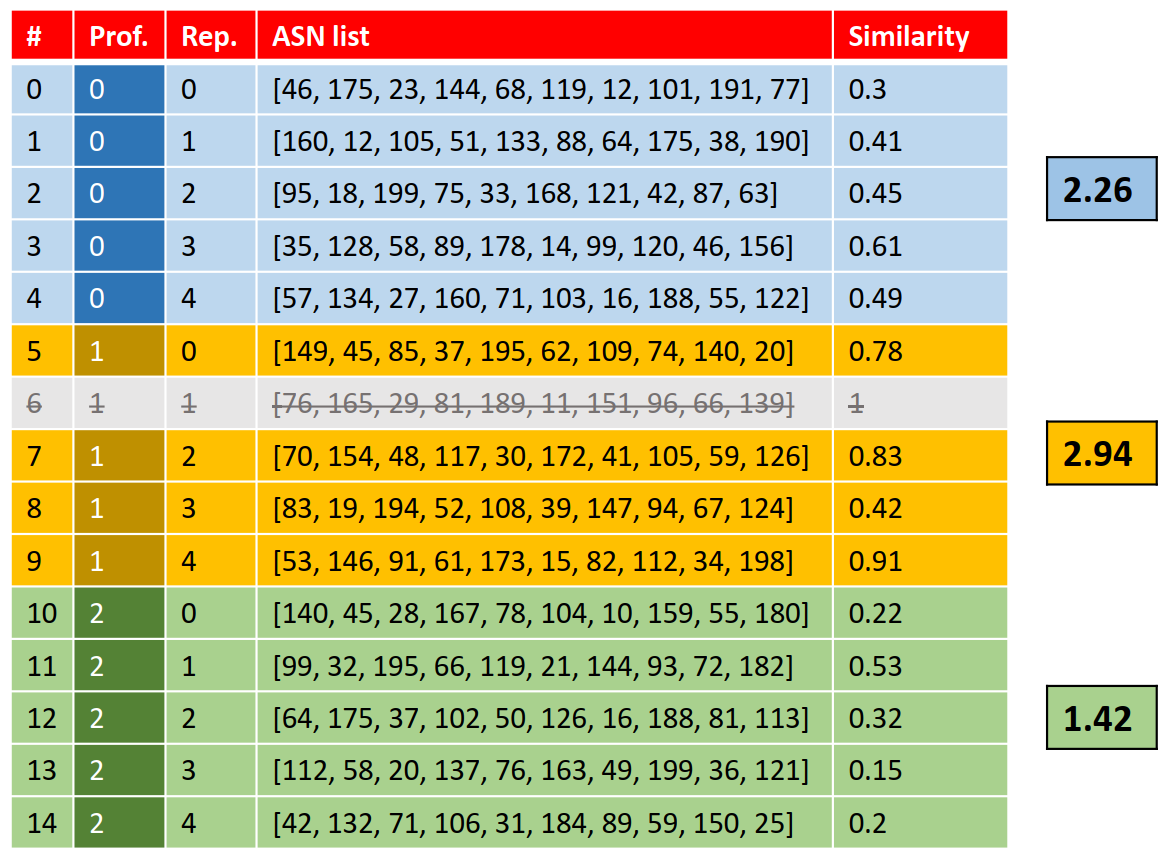
We can now see that profile 1 has the highest aggregated similarity with ASN list [76, 165, 29, 81, 189, 11, 151, 96, 66, 139]. This means that the user to which this ASN list belongs, is most likely the user from profile 1. We can now verify this by checking the filename of the pcap file from which we derived this ASN list: profile-1-repetition-1.pcap. This filename says that profile 1 is indeed the corresponding profile. This means that our guess is correct in this example. It is also possible that this same method would lead to a wrong guess. In fact, the correctness of our guess depends on the similarities and thus on the accurateness of the distance metric that was used. We can therefore compare the performance of the different distance metrics.
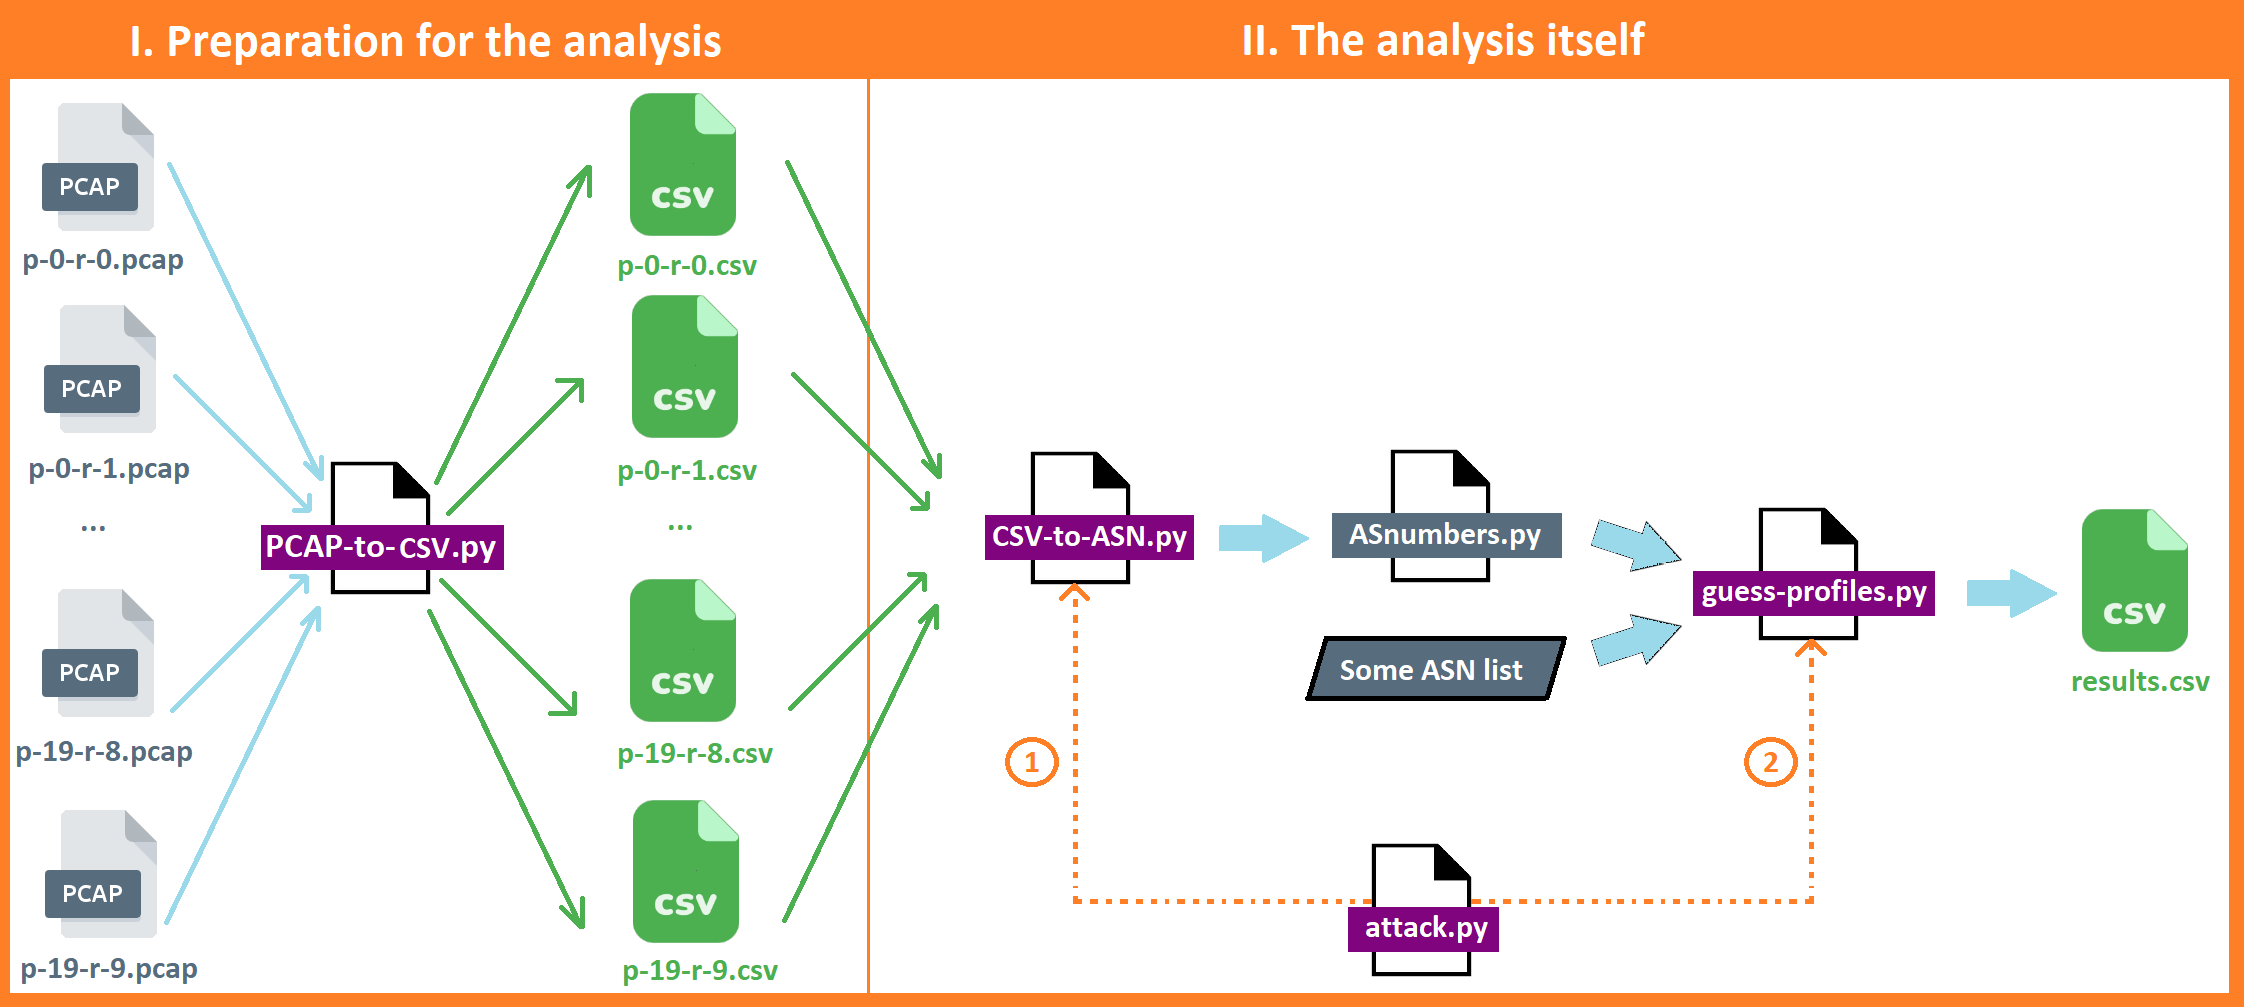
First, we will convert the pcap files to CSV files. Using TShark, we will extract the IP addresses from the pcap files and convert them to AS numbers. Together with the timestamp at which they were found in the pcap file, we can put them into a CSV file. By doing so, we avoid having to engage in these time-consuming processes over and over again when comparing pcap files. Instead, we can now compare the CSV files by deriving ASN lists from them.
We can then run a set of scripts that attempts to determine the profile that was used in each pcap file. The script attack.py runs these scripts in order and then the results will be appended to results.csv. The attack will try this for the full 60 minutes of each pcap file, but we can also do this for shorter periods of time, such as 30 minutes, 20 minutes, 10 minutes, 5 minutes or even 1 minute. In those cases, only a part of CSV files will be taken and compared to the same part of the other CSV files. The performance of the attack will then be compared to taking a different part of the CSV files of the same durations.
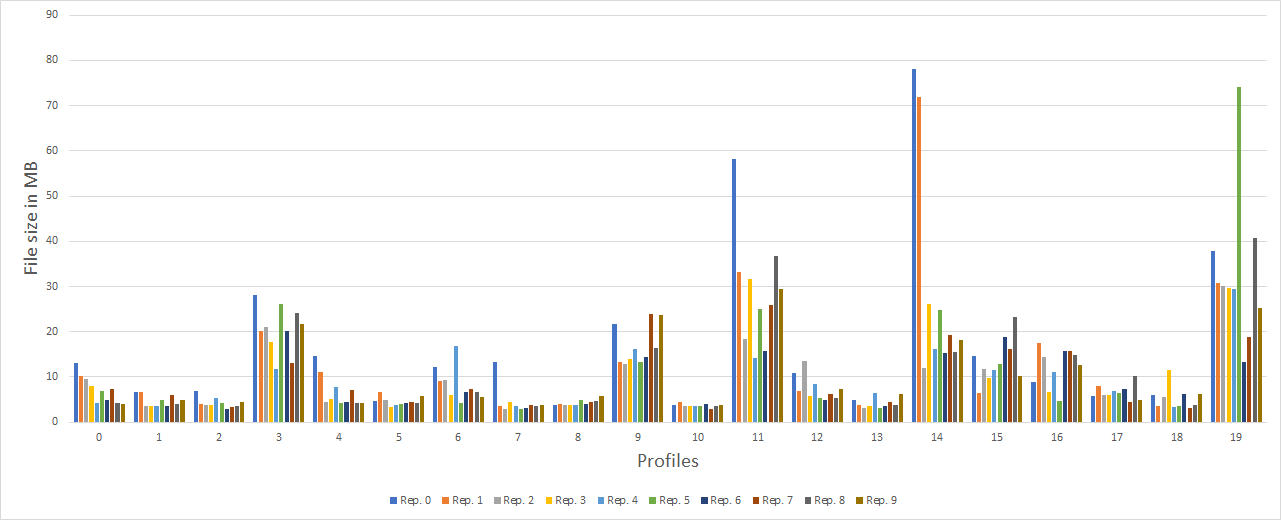
When looking at the size of the pcap files, we can already see something interesting. They seem to be different for each profile, but more or less consistent among the different repetitions. In other words, the amount of traffic that is generated, depends on what profile was activated. This is the first indication that the set of apps that is activated does indeed result into traffic with distinguishable characteristics.
60 minutes of data
Below are the results when we look at all the data in the 60 minute recordings. For each distance metric, we show for how many of the 200 pcap files we are able to correctly determine the profile using the analysis methods described above.
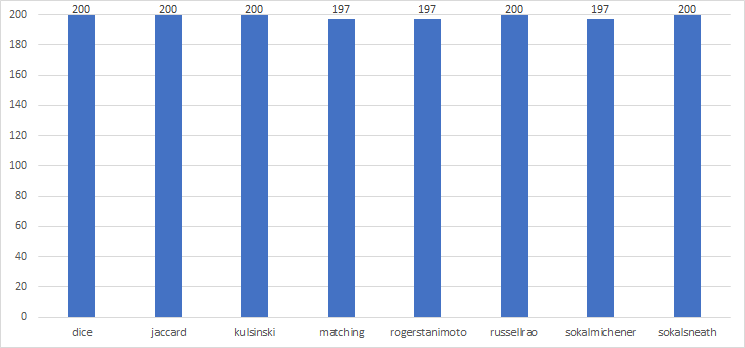
As you can see, the attacker is able to determine the profile of the pcap correctly in 200 out of 200 cases with many of the different distance metrics. This means that we have a success rate of 100% when choosing the right distance metric.
30 minutes of data
In the picture below, you see two bars for every distance metric. This is because we are evaluating the performance of our attack by taking 30 minutes of data from the pcap files. The pcap files contain a recording of 60 minutes of data, so we could take the first half or the second half of each pcap file. We compare the performance of both halfs in the graph below.
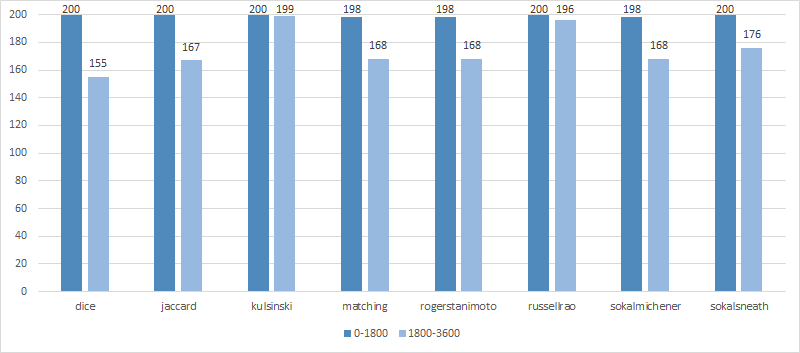
The first bar is higher for almost every distance metric. This means that if you take the first half of every recording, you get a higher success rate. We don't want to cheat, which is why compare both time intervals. Interestingly, both time intervals score almost equally when using Kulsinski distance metric.
20 minutes of data
We can take the first 20 minutes of each pcap, the middle 20 minutes or the last 20 minutes of each pcap file. In the graph below, we will compare the performance of our attack for all three intervals using the different distance metrics.
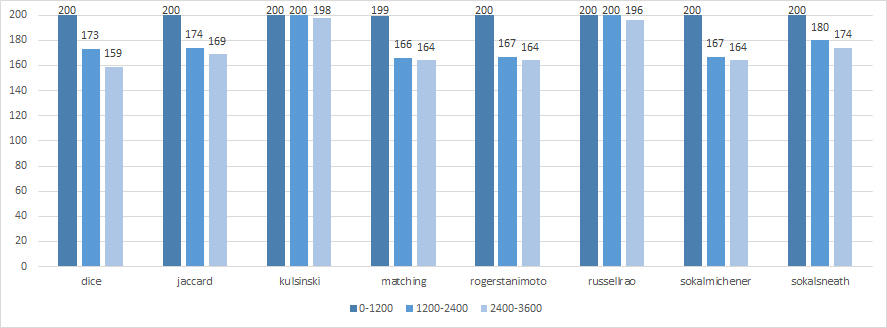
While the success rate of our attack seems to decrease if you pick a later time interval, this does not seem to apply to Kulsinski. This distance metric is still able to get a success rate of 99% when you use the latest 20 minutes of each pcap file.
10 minutes of data
Because our pcap files have 60 minutes of data in them, we could extract six 10 minute time intervals from them and compare their performance for every distance metric.
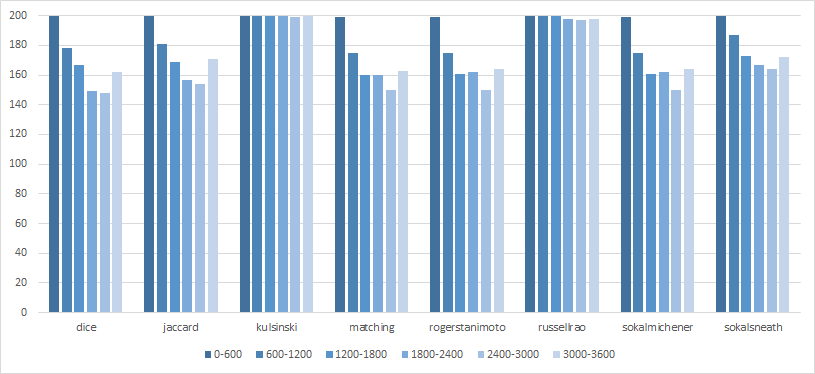
Again, Kulsinski seems to be very stable and performs best compared to the other distance metrics that seem to depend on which time-interval is chosen. There is one time interval where Kulsinski gets the profile from 199 out of 200 pcap files correctly, which is a success rate of 99.5%. For the other five 10 minute time intervals, Kulsinski gets a 100% success rate.
5 minutes of data
For the twelve 5 minute time-intervals in the 1 hour recording, we observe the same we saw in the 10 minute time intervals:
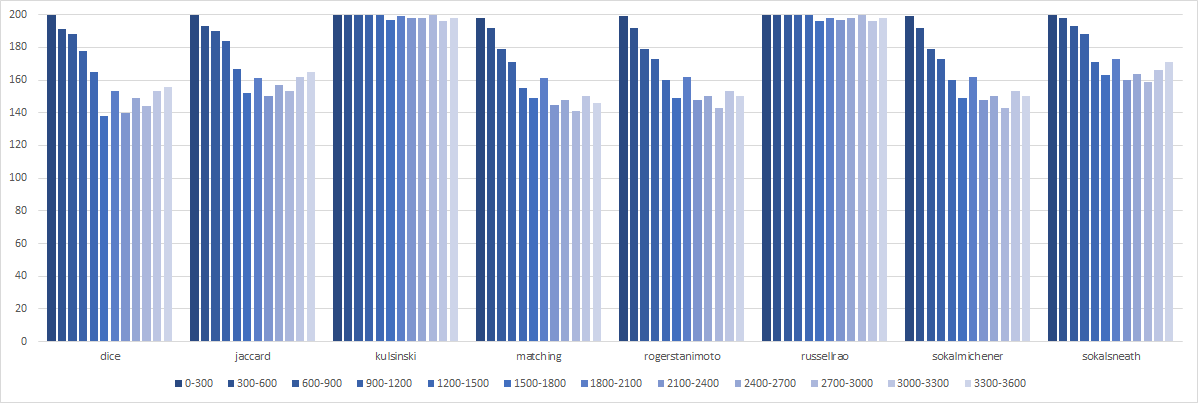
Kulsinski performs by far the best again, whereas the rest is dependent on which time interval is chosen.
1 minute of data
Here we compare sixty time intervals of 1 minute for each distance metric

We can now see that every distance metric performs worse for later time intervals, even Kulsinski.
Looking at the results above, we see that Kulsinski is the best distance metric for our attack. When using that distance metric, we can summarize the results as follows:

The one minute time intervals have success rate of 72% in the worst case scenario. Some one minute time intervals are able to achieve the 100% success rate, but this is rare. This is why the average success rate is 85%. While this is quite high, it might not be considered high enough to be reliable. However, keep in mind that this is achieved with 1 minute recordings only. For every additional minute that the attacker records, the score will be higher. If the attacker is able to record for only as little as 5 minutes, he already gets a 98% success rate in the worst case scenario. We only observed this for one 5 minute time interval. All of the other time intervals scored even higher. Most of them even scored 100% success rate, which is why the average success rate for 5 minute recordings or longer is about 99.6%.
Conclusion
Using our attack we can derive the user to the which passive app traffic belongs with an alarmingly high success rate. This is of course a great privacy threat that demonstrates the urgent need to take appropriate countermeasures against this attack. This includes encouraging the usage of VPN, Tor, proxy or related amongs mobile users, as this will make it impossible to rely on the extracting of IP addresses in our attack. However, the VPN provider must be a trusty party. Otherwise, they will be the attacker. Moreover, future variations of this attack might extract different data, which means that additional countermeasures need to be taken, depending on what that variation might look like. Therefore, it's crucial to spread awareness about this attack, keep researching this attack and stay hypervigilant against future versions of this attack.
More information
Please have a look at the PDF file for more detailed information and implications.

